Monthly Archives: December 2013

NAEP TUDA: Does Black Poverty Matter?

In my last post, I point out that it makes as much sense to compare black scores in Boston and Detroit as it does to compare white scores in Vermont and West Virginia (not that people don’t do that, too), given the substantial difference in black poverty rates.

There are all sorts of actual social scientists investigate race and poverty, and I’m not trying to reinvent the wheel. I don’t need to prove that poverty has a strong link to academic achievement. Apparently, though, some people in the education industry need to be reminded. So part 2 of my rationale for digging into the poverty rates (with the first being lord, they’re hard to find) is that I wanted to remind people that we need to look at both factors. Ultimately, it doesn’t matter if my data analysis here is correct or I screwed it up. If people start demanding to know how poverty affects outcomes controlled for race—whether my analysis is correct or not—then this project has been worthwhile. Even given the squishy data with various fudge factors, there appears to be a non-trivial relationship, as you’ll see.

But the third part of my rationale for taking this on is linked to my curiosity about the data. Would it support—or, more accurately, not conflict with—my own pet theory?

I expected that my results would show a link between poverty and test scores after controlling for race, although given the squishiness of both the data I was using, the small sample size and NAEP’s sampling (which would be by NSLP participation, not poverty), I didn’t expect it to explain all of the variance.

But I also think it likely that poverty saturation, for lack of a better word, would have an additional impact. So Detroit has lots of blacks, Fresno doesn’t. But they both have a high rate of overall poverty, and since poverty is correlates both with low ability and, alas, low incentive, the classes are brutally tough to teach with all sorts of distractors. Disperse the poor kids and far more of them will shrug and pay attention, with only a few dedicated troublemakers determined to screw things up no matter what the environment.

This is hardly groundbreaking; that belief is behind the whole push for economic integration, it’s how gentrifiers are rationalizing their charter schools, and so on. I don’t agree with the fixes, and of course I don’t think that poverty saturation explains the achievement gap, but I believe the problem’s real enough to singlehandedly account for the small and functionally insignificant increase in some charter school test scores. I have more thoughts on this, but it would distract from my main purpose here, so hold on to that point. For now, I was also digging into the data for my own purposes, to see if it didn’t contradict my own idea of poverty’s impact.

Poverty Variables

I thought these rates might be related, all for the districts (not the cities):

  • Percentage of enrolled black students in poverty (as a percentage of all black students)
  • Percentage of enrolled black students in poverty (as a percentage of all students)
  • Percentage of enrolled poor kids
  • Percentage of enrolled poor black kids (as a percentage of all poor kids)
  • Percentage of blacks in poverty (overall, adults and kids, from ACS)

In my last post, I discussed the difficulty of assigning the correct number of poor black students to the district. Should I assume the enrolled poverty rate is the same as the district poverty rate for black and poor children, or assume that the bulk of the poor children enrolled in district schools, thus raising the poverty rate? This makes a huge difference in schools that only enroll 50-60% of the district students. I decided to assign all the poor kids to the district schools, which will overstate the poverty levels, but nowhere near as much as the reverse would distort them. So all the above poverty levels involving enrolled students assume that all poor kids enroll in district schools–that is, I used the far right row of each of the three poverty measures shown in the table below.

(Notice that in a few cases, the ACS poverty level is higher than the assigned poverty rate, which is nutty. But I’m creating the black child poverty rate by adding up children in and children not in poverty, rather than using children in poverty and total black children, to be consistent.)

Boston was the only school district I could find that provided data on how many district kids weren’t enrolled, what percent by race, and where they were (parochial, private, charters, homeschooled). Thanks, Boston!

bostonenrollment

How likely was it that all these kids were evenly pulled from every level of the income spectrum?

I also don’t think it’s a coincidence that the weakest schools have the greatest discrepancies in the two calculations. Particularly of interest is DC, which has a low black poverty rate, a low enrollment rate (because half the kids are in charters), and one of the lowest performers using my test metric (see below) Given that no one has established breathtakingly different academic performances between charter and public schools, it doesn’t seem likely that DC’s lower than expected performance is caused by purely by crappy teaching of a mostly middle class crowd.

Plus, I’m a teacher in a public school, and like most teachers in public schools, I see charter-skimming in action. I see the top URM kids go off to charter schools from high poverty high schools, and I see the misbehavers get kicked back to the public schools. To hell with the protestations and denial, I see cherrypicking in action. And there you see emotions at play. But only after two logical arguments.

So all the bullet points except the last one use that same assumption. And I know it’s a fudge factor, but it’s the best I could do. Here’s hoping the feds will give us a better measure in the future.

Other Variables

  • Percent of district kids enrolled (using ACS data and school/census enrollment numbers)
  • Percent of enrolled kids who are black (from district websites)
  • Percent of black students scoring basic or higher in 8th grade math

I decided to go with basic or higher because seriously, NAEP proficiency is just a stupidly high marker. This is the value I used as the dependent variable in the regressions.

Analysis and Results

What I looked for: well, hell. I don’t do math, dammit, I teach it. I figured I’d look for the highest R squared I could find and p-values between 0 and .05. When I started, I’d have been thrilled with anything explaining over 50% of the variation, so I decided that I’d give the results if I got 40% or higher for any one variable, and over 60% for multiple regressions. I used the correlation table to give me pointers:

naepcorrelation

The red and black is just my own markings to see if I’d caught all the possibilities. Red means no value in multiple regressions, bold means there’s a strong correlation, italic and bold means it might be a good candidate for multiple regressions. As I mention below, I kind of run out of steam later, so I’m going to come back to this to see if I missed any possibilities.

I don’t usually do this sort of thing, and I don’t want the writing to drown in figures. So I’ll just link in the results.

Single % Poor Enrolled (Approx) poor blks/Tot kids % Black Enrollment (frm dist) % Poor Kids in District Dist Overall Blk Pov
% poor blacks enrolled (approx) 0.463 0.520 0.607 0.593 0.551 0.574
% Poor Enrolled (Approx) 0.398 0.527 0.700
poor blks/Tot kids 0.516 0.640
% Black Enrollment (frm dist) 0.217 0.612
% Poor Kids in District 0.160
% blk kids poor in dist (ACS) 0.319
Dist Overall Blk Pov 0.488
% of 5-17 kids enrolled 0.216
Poor blcks/Poor 0.161

I ran some of the other multiple regressions and am pretty sure I didn’t get any other strong results, but honestly, yesterday I just ran out of steam. I have a brother showing up to help me move on Saturday, and he’ll be pissed if I’m not packed up. Normally I’d just put this off, but I’ve got two or three other “put offs” and I’m close enough to “done” on this that I want it over.

Scatter plots for the single regressions:

Apparently you can’t do a scatter plot for multiple regressions. Here’s what I did just to see if it worked, using the winning multiple regression of Overall Black Poverty and Total Enrolled Poverty:

naepmultregscatterenrpovdistblkpov

I calculated the predicted value for each district using the two slopes and the y-intercept. Then I graphed predicted versus actual scores on a scatter plot and added a trend line. Is it just a coincidence that the r square of the trendline is the same as the r square for the multiple regression? I have no idea. If this is totally wrong, I’ll kill it later, but I’m genuinely curious if this is right or wrong, or if Excel does this and I just don’t know how to tell it to graph multiple regressions.

Again, I’m not trying to prove anything. I believe it’s already well-established that poverty within race correlates with academic outcomes. I was just trying to collect the data to remind people who discuss NAEP scores in the vacuum of either race or poverty that both matter.

And here, I’m going to stop for now. I am deliberately leaving this open-ended. If I didn’t screw up and if I understand the stats behind this, it appears that certain black poverty and overall poverty factors explain anywhere from 40 to 60% of the variance in the NAEP TUDA scores. Overall district poverty and total enrolled poverty combine to explain 70%. In my fuzzy, don’t fuss me too much with facts world view, this doesn’t contradict my poverty saturation theory. But beyond that, I want more time to mull this. I’ve already noticed some patterns I want to write more about (like my doctored black poverty number wasn’t as good as overall district black poverty, but my doctored total poverty number worked well—huh), but I’m feeling done, and I’d really like to get feedback, if anyone’s interested. I’m fine with learning that I totally screwed this up, too. Unlike the last post, where I feel pretty solid on the data collection, I’m new at this. If you want to see the very messy google docs file with all the data, gmail me at this blog name.

Two posts in two days is some sort of record for me–and three posts in a week to boot.

I’ll have my retrospective post tomorrow, I hope, since I’ve posted on Jan 1 every year of my blog so far. Hope everyone has a great new year.


NAEP TUDA Scores—Detroit isn’t Boston

So everyone is a-twitter over NAEP TUDA (Trial Urban District Assessment) scores. For those who aren’t familiar with The Nation’s Report Card, the “gold standard” of academic achievement metrics, it samples performance rather than test every student. For most of its history, NAEP only provided data at the state level. But some number of years ago, NAEP began sampling at the district level, first by invitation and then accepting some volunteers.

I don’t know that anyone has ever stated this directly, but the cities selected suggest that NAEP and its owners are awfully interested in better tracking “urban” achievement, and by “urban” I mean black or Hispanic.

I’m not a big fan of NAEP but everyone else is, so I try to read up, which is how I came across Andy Smarick‘s condemnation of Detroit, Milwaukee, and Cleveland: “we should all hang our heads in shame if we don’t dramatically intervene in these districts.”

Yeah, yeah. But I was pleased that Smarick presented total black proficiency, rather than overall proficiency levels. Alas, my takeaway was all wrong: where Smarick saw grounds for a federal takeover, I was largely encouraged. Once you control for race, Detroit looks a lot better. Bad, sure, but only a seventh as bad as Boston.

So I tweeted this to Andy Smarick, but told him that he couldn’t really wring his hands until he sorted for race AND poverty.

He responded “you’re wrong. I sorted by race and Detroit still looks appalling.”

He just scooted right by the second attribute, didn’t he?

Once I’d pointed this out, I got curious about the impact that poverty had on black test scores. Ironic, really, given my never-ending emphasis on low ability, as opposed to low income. But hey, I never said low income doesn’t matter, particularly when evaluating an economically diverse group.

But I began to wonder: how much does poverty matter, once you control for race? For that matter, how do you find the poverty levels for a school district?

Well, it’s been a while since I did data. I like other people to do it and then pick holes. But I was curious, and so went off and did data.

Seventeen days later, I emerged, blinking, with an answer to the second question, at least.

It’s hard to know how to describe what I did during those days, much less put it into an essay. I don’t want to attempt any sophisticated analysis—I’m not a social scientist, and I’m not trying to establish anything certain about the impact of poverty on test scores, an area that’s been studied by people with far better grades than I ever managed. But at the same time, I don’t think most of the educational policy folk dig down into poverty or race statistics at the district level. So it seemed like it might be worthwhile to describe what I did, and what the data looks like. If nothing else, the layperson might not know what’s involved.

If my experience is any guide, it’s hard finding poverty rates for children by race. You can get children in poverty, race in poverty, but not children by race in poverty. And then it appears to be impossible to find enrolled children in a school district—not just who live in it, which is tough enough—by poverty. And then, of course, poverty by enrollment by race.

First, I looked up the poverty data here (can’t provide direct links to each city).

But this is overall poverty by race, not child poverty by race, and it’s not at the district level, which is particularly important for some of the county data. However, I’m grateful to that site because it led me to American Community Survey Factfinder, which organizes data by all kinds of geographic entities—including school districts—and all kinds of topics–including poverty—on all sorts of groups and individuals—including race. Not that this is news to data geeks, which I am not, so I had to wander around for a while before I stumbled on it.

Anyway. I ran report 1701 for the districts in question. If I understand googledocs, you can save yourself the trouble of running it yourself. But since the report is hard to read, I’ll translate. Here are the overall district black poverty rates for the NAEP testing regions:

ACSdistrictblkpoverty

Again, these are for the districts, not the cities.

(Am I the only one who’s surprised at how relatively low the poverty rates are for New York and DC? Call me naïve for not realizing that the Post and the Times are provincial papers. Here I thought they focused on their local schools because of their inordinately high poverty rates, not their convenient locations. Kidding. Kind of.)

But these rates are for all blacks in the district, not black children. Happily, the ACS also provides data on poverty by age and race, although you have to add and divide in order to get a rate. But I did that so you don’t have to–although lord knows, my attention to detail isn’t great so it should probably be double or triple checked. So here, for each district, are the poverty rates for black children from 5-17:

ACSblk517poverty

In both cases, Boston and New York have poverty rates a little over half those of the cities with the highest poverty rates—and isn’t it coincidental that the four cities with the lowest black NAEP scores have the highest black poverty rates? Weird how that works.

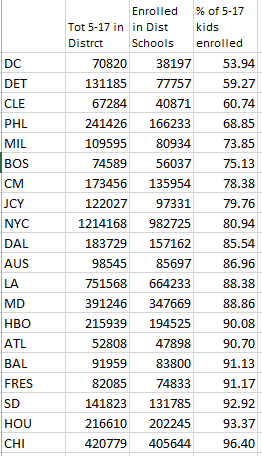
But the NAEP scores and the district data don’t include charter or private schools in the zone, and this impacts enrollment rates differently. So back to ACS to find data on age and gender, and more combining and calculating, with the same caveats about my lamentable attention to detail. This gave me the total number of school age kids in the district. Then I had to find the actual district enrollment data, most of which is in another census report (relevant page here) for the largest school districts. The smaller districts, I just went to the website.

Results:

naepdistenrollrate

Another caveat–some of these data points are from different years so again, some fuzziness. All within the last three or four years, though.

So this leads into another interesting question: the districts don’t report poverty anywhere I can find (although I think some of them have the data as part of their Title I metrics) and in any event, they never report it by race. I have the number and percent of poor black children in the region, but how many of them attend district schools?

So to take Cleveland, for example, the total 5-17 district population was 67,284. But the enrolled population was 40871, or 60.7% of the district population.

According to ACS, 22,445 poor black children age 5-17 live in the district, and I want an approximation of the black and overall poverty rates for the district schools. How do I apportion poverty? I do not know the actual poverty rate for the district’s black kids. I saw three possibilities:

  1. I could use the black child poverty rate for the residents of the Cleveland district (ACS ratio of poor black children to ACS total black children). That would assume (I think) that the poor black children were evenly distributed over district and non-district schools.
  2. I could have take the enrollment rate and multiplied that by the poor black children in ACS—and then use that to calculate the percentage of poor kids from blacks enrolled.
  3. I could assign all the black children in poverty (according to ACS) to the black children enrolled in the district (using district given percentage of black children enrolled).

Well, the middle method is way too complicated and hurts my head. Plus, it didn’t really seem all that different from the first method; both assume poor black kids would be just as likely to attend a charter or private school than they would their local district school. The third method assumes the opposite—that kids in poverty would never attend private or charter schools. This method would probably overstate the poverty rates.

So here are poverty levels calculated by methods 1 and 3–ACS vs assigning all the poor black students to the district. In most cases, the differences were minor. I highlight the districts that have greater than 10 percentage points difference.

naepweightingpov

Again, is it just a coincidence that the schools with the lowest enrollment rates and the widest range of potential poverty rates have some of the lowest NAEP scores?

Finally, after all this massaging, I had some data to run regression analysis on. But I want to do that in a later post. Here, I want to focus on the fact that gathering this data was ridiculously complicated and required a fair amount of manual entry and calculations.

If I didn’t take the long way round, I suspect this effort is why researchers use the National Student Lunch Program (“free and reduced lunch”) as a poverty proxy.

The problem is that the poverty proxy sucks, and we need to stop using it.

Schools and districts have noticed that researchers use National School Lunch enrollment numbers as a proxy for poverty, and it’s also a primary criterion for Title I allocations. So it’s hard not to wonder about Boston’s motives when the district decides to give all kids free lunches regardless of income level, and whether it’s really about “awkward socio-economic divides” and “invasive questions”. The higher the average income of a district’s “poor” kids, the easier it is to game the NCLB requirements, for example.

Others use the poverty proxy to compare academic outcomes and argue for their preferred policy, particularly on the reform side of things. For example, charter school research uses the proxy when “proving” they do a “great job educating poor kids” when in fact they might just be skimming the not-quite-as-poor kids and patting themselves on the back. We can’t really tell. And of course, the NAEP uses the poverty proxy as well, and then everyone uses it to compare the performance of “poor” kids. See for example, this analysis by Jill Barshlay, highlighted by Alexander Russo (with Paul Bruno chiming in to object to FRL as poverty proxy). Bruce Baker does a lot of work with this.

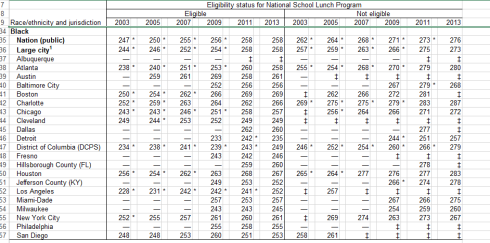
To see exactly how untrustworthy the “poverty proxy is”, consider the NAEP TUDA results broken down by participation in the NSLP.

naepfrlelig

Look at all the cities that have no scores for blacks who aren’t eligible for free or reduced lunch: Boston, Cleveland, Dallas, Fresno, Hillsborough County, Los Angeles, Philadelphia, and San Diego. These cities apparently have no blacks with income levels higher than 180% of poverty. Detroit can drum up non-poor blacks, but Hillsborough County, Boston, Dallas, and Philadelphia can’t? That seems highly unlikely, given the poverty levels outlined above. Far more likely that the near-universal poverty proxy includes a whole bunch of kids who aren’t actually poor.

In any event, the feds, after giving free lunches to everyone, decided that NSLP participation levels are pretty meaningless for deciding income levels “…because many schools now automatically enroll everyone”.

I find this news slightly cheering, as it suggests that I’m not the only one having a hard time identifying the actually poor. Surely this article would have mentioned any easier source?

So. If someone can come back and say “Ed, you moron. This is all in a table, which I will now conveniently link in to show you how thoroughly you wasted seventeen days”, I will feel silly, but less cynical about education policy wonks hyping their notions. Maybe they do know more than I do. But it’s at least pretty likely that no one is looking at actual district poverty rates by race when fulminating about academic achievement, because what I did wasn’t easy.

Andy Smarick, at any rate, wasn’t paying any attention to poverty rates. And he should be. Because Detroit isn’t Boston.

This post is long enough, so I’ll save my actual analysis data for a later post. Not too much later, I hope, since I put a whole bunch of work into it.


Social Justice and Winning the Word

Robert Pondiscio got cranky with me on Twitter. I don’t translate well to 140 characters. I barely translate to 1400 words.

In Who’s the Real Progressive?, Pomdiscio got all “in your FACE!” with Steve Nelson, head of Calhoun School (tuition $40K), who snippily dismissed Pomdiscio’s school as “not progressive”. Pomdiscio was outraged. How dare he say that a school dedicated to helping black and Hispanic kids succeed isn’t progressive?

I told him he was needlessly fussed. “Social justice” and “progressive” are two terms firmly ensconced in liberal ideology with specific meanings about means, not outcomes. He should know that. I was told off in no uncertain terms. Pondiscio pointed out that he didn’t ask me for advice. True enough, and if he didn’t want unsolicited responses, he might try email next time.

But since I’ve escaped the bonds of Twitter….

Twenty years ago, I used to say I agreed with the goals of feminism and then qualified that statement: I can’t stand NOW, I think feminism has gone far afield, blah blah blah. Now I say I’m opposed to feminism, because I believe that women should have equal rights and responsibilities.

But Ed, a feminist will say, feminism is about women having equal rights and responsibilities.

And I laugh. “Hahahahaha! Good one!”

Of course, at the heart of this exchange lies a cold hard truth: feminists won the word.

I can’t tell you how many times I’ve heard teachers (usually English and history) talk about how they want their kids to “develop a positive value system” in the context of a recycling program or anti-bullying week. If they are trying to institute “social justice” values then it’s a panel on gay marriage, affirmative action, or the Dream Act.

Me, I don’t participate in the recycle program. When the kids ask me why, I tell them I want to hurt the environment. I was bullied into accepting a sticker during anti-bullying week, but I didn’t wear it, telling my students I’m anti-bullying, but also anti-anti-bullying. When students tell me they oppose gay marriage, gun rights, or the Dream Act, I simply warn them to watch their audience or have a lawyer on call. I would also mention whether I agreed or disagreed, just as I would with students with opposing views.

And if I’m asked whether I support social justice, I say no, because I support free speech and the right to individual opinion.

But Ed, says a liberal teacher, social justice is all about free speech and the right to individual opinion.

Hahahahaha! I say. Good one!

Again, a sad truth at the heart of it all: liberals won the words.

And that’s all I was trying to tell Robert Pondiscio. By all means, take on the absurd assumption that a progressive school must teach a curriculum drenched in liberal propaganda and enforce a rigid ideology about “social justice” that only acknowledges “white institutionalized racism” and “white male patriarchy” as wrongs imposed upon a minority populace bravely struggling against the jackboot on their necks. I’m all for it. While you’re at it, go take on ed schools not for their curriculum (it’s not that bad) but for their routine violations of academic freedom and the elite ed schools’ systematic exclusion of conservatives or Republicans from their student population, implying, but never daring to say directly, that the right’s political agenda is incompatible with worthwhile educational outcomes. I’m there.

But spewing outrage when a progressive tells you that your school isn’t progressive because you believe in good test scores for and enforce tough discipline against black and Hispanic kids? Of course it’s not progressive to insist on homogeneous cultural success and behavior markers. Progressives don’t care about ends, they care about means. Did the teachers spout liberal values and espouse progressive dogma? It’s progressive. Otherwise, not. They won the word. Cope.

Of course, the real irony is that reformers, whether choice, accountability, or curriculum, rarely question the liberal ideal of “social justice” and “progressive values” in at least one key respect. As I’ve written before, reformers of all stripes have completely embraced the progressive agenda for educational outcomes: affirmative action, the DREAM act, special education mainstreaming (for public schools, not for charters, of course), support for non-English speakers. They’re only arguing about means.

Note that the students in Robert Pondiscio’s essay with the happy stories about college acceptance to Brown and Vanderbilt, are all black and they almost certainly got in with lower test scores than if they’d had the same income but were white or Asian. A substantial number of Americans don’t see social justice in the notion of accepting far less qualified kids, often of higher income, simply because of their skin color. And yet Pondiscio offers his story as an unalloyed example of a progressive outcome, of social justice.

In fact, he wouldn’t even be writing happy stories about poor whites or Asians, just as you don’t see KIPP cutting admission deals for white and Asian students, because reformers aren’t starting charter schools to help poor whites or Asians.

Suburban upper-income whites, sure. Reformers are all about wealthy suburban whites for the same reason that Willie Sutton robs banks. Progressive charter schools for liberal whites trying to escape the overly brown and poor population of their local schools are on the rise. These schools aren’t reliant on philanthropists, but well-to-do parents willing to provide seed money to bootstrap the initial efforts. Poor or even middle class whites need not apply: they don’t bring the color the schools will need to prove the “diverse” population. They can apply for the lottery, eventually. (“Poor” Asians are a different story; it’s largely how the Chinese takeover of American Indian Public Charter went unnoticed. Chinese and Koreans bring all sorts of money from back home but have little money on paper, so often count as “low income”. Doesn’t stop them from buying up real estate, often, literally, with cash.)

You’ll go a long, long time looking for reformers’ advocacy of any issue that benefits poor whites, or even suburban whites not rich enough to write a check for seed money. In fact, I’d argue that increased choice is one aspect of reform that will hurt poor and middle-class whites, since no one’s interested in starting schools for them.

So Pondiscio’s brouhaha: Steve Nelson claims he’s progressive because he enforces liberal think on a bunch of rich white students and gives lip service to getting low income black and Hispanic kids get into college, probably with a couple–but not too many–Calhoun scholarships. Robert Pondiscio claims he’s more progressive because he works for a school that gets more black and Hispanic kids get into elite colleges, thanks to progressive universities’ belief in affirmative action and wealthy conservative organizations eager to fund selective charter schools instead of writing $40K scholarships, the better to prove that traditional schools and unionized teachers suck.

The cataclysmic nature of their disagreement on progressive values involves the degree to which culturally homogenous discipline should be enforced while pursuing the unquestioned good of allocating resources for a select group of black and Hispanic students. And, I guess, whether $40K tuition scholarships for low income black and Hispanic students are morally inferior to them winning a lottery to a nominally public school funded by billionaires directly, rather than through scholarships.

Okay. Well. Glad we got thatstraightened out.

Meanwhile, we’re a long way from a world in which we give all low income kids an equal shot, regardless of race. We’re not even at the point where each demographic has its own group of interested billionaires to fund selective schools for a lucky few.

Bah, Humbug.


The Negative 16 Problems and Educational Romanticism

I came up with a good activity that allowed me to wrap up quadratics with a negative 16s application. (Note: I’m pretty sure that deriving the algorithm involves calculus and anyway, was way beyond the scope of what I wanted to do, which was reinforce their understanding of quadratics with an interesting application.) As you read, keep in mind: many worksheets with lots of practice on binomial multiplication, factoring, simpler models, function operations, converting quadratics from one form to another, completing the square (argghh) preceded this activity. We drilled, baby.

I told the kids to get out their primary quadratics handout:

parabolaforms

Then I showed two model rocket launches with onboard camera (chosen at random from youtube).

After the video, I toss a whiteboard marker straight up and caught it. Then I raised my hand and drop the marker.

“So the same basic equation affects the paths of this marker and those rockets–and it’s quadratic. What properties might affect—or be affected by—a projectile being launched into the air?”

The kids generated a list quickly; I restated a couple of them.

pmpfactors

Alexandra: “What about distance?”

I pretended to throw the marker directly at Josh, who ducked. Then I aimed it again, but this time angling towards the ceiling. “Why didn’t Josh duck the second time?”

“You wouldn’t have hit him.”

“How do you know?”

“Um. Your arm changed…angles?”

“Excellent. Distance calculations require horizontal angles, which involves trigonometry, which happens next year. So distance isn’t part of this model, which assumes the projectile is launched straight….”

“UP.”

“What about wind and weather?” from Mark.

“We’re ignoring them for now.”

“So they’re not important?”

“Not at all. Any of you watch The Challenger Disaster on the Science Channel?”

Brad snickered. “Yeah, I’m a big fan of the Science Channel.”

“Well, about 27 years ago, the space shuttle Challenger exploded 70 some seconds after launch, killing everyone on board when it crashed back to earth.” Silence.

“The one that killed the teacher?”

“Yes. The movie—which is very good—shows how one man, Richard Feynman, made sure the cause was made public. A piece of plastic tubing was supposed to squeeze open and closed—except, it turns out, the tubing didn’t operate well when it was really cold. The launch took place in Florida. Not a place for cold. Except it was January, and very cold that day. The tubing, called O-ring, compressed—but didn’t reopen. It stayed closed. That, coupled with really intense winds, led to the explosion.”

“A tube caused the crash?”

“Pretty much, yes. Now, that story tells us to sweat the small stuff in rocket launches, but we’re not going to sweat the small stuff with this equation for rocket launches! We don’t have to worry about wind factors or weather.”

“Then how can it be a good model?” from Mark, again.

“Think of it like a stick figure modeling a human being but leaving out a lot. It’sstill a useful model, particularly if you’re me and can’t draw anything but stick figures.”

So then we went through parameters vs. variables: Parameters like (h,k) that are specific to each equation, constant for that model. Variables–the x and y–change within the equation.

“So Initial Height is a parameter,” Mark is way ahead.

Nikhil: “But rocket height will change all the time, so it’s a variable.”

Alissa: “Velocity would change throughout, wouldn’t it?”

“But velocity changes because of gravity. So how do you calculate that?” said Brad.

“I’m not an expert on this; I just play one for math class. What we calculate with is the initial velocity, as it begins the journey. So it’s a parameter, not a variable.”

“But how do you find the initial velocity? Can you use a radar gun?”

“Great question, and I have no idea. So let’s look at a situation where you’ll have to find the velocity without a radar gun. Here’s an actual—well, a pretend actual—situation.”neg16question

“Use the information here to create the quadratic equation that models the rocket’s height. In your notes, you have all the different equation formats we’ve worked with. But you don’t have all the information for any one form. Identify what information you’ve been given, and start building three equations by adding in your known parameters. Then see what you can add based on your knowledge of the parabola. There are a number of different ways to solve this problem, but I’m going to give you one hint: you might want to start with a. Off you go.”

And by golly, off they went.

As releases go, this day was epic. The kids worked around the room, in groups of four, on whiteboards. And they just attacked the problem. With determination and resolve. With varying levels of skill.

In an hour of awesomeness here is the best part, from the weakest group, about 10 minutes after I let them go. Look. No, really LOOK!

net16classwork3

See negative 2.5 over 2? They are trying to find the vertex. They’ve taken the time to the ground (5 seconds) and taken half of it and then stopped. They were going to use the equation to find a, but got stuck. They also identified a zero, which they’ve got backwards (0,5), and are clearly wondering if (0,4) is a zero, too.

But Ed, you’re saying, they’ve got it all wrong. They’ve taken half of the wrong number, and plugged that—what they think is the vertex—into the wrong parameter in the vertex algorithm.. That’s totally wrong. And not only do they have a zero backwards, but what the hell is (0,4) doing in there?

And I say you are missing the point. I never once mentioned the vertex algorithm (negative b over 2a). I never once mentioned zeros. I didn’t even describe the task as creating an equation from points. Yet my weakest group has figured out that c is the initial height, that they can find the vertex and maybe the zeroes. They are applying their knowledge of parabolas in an entirely different form, trying to make sense of physical data with their existing knowledge. Never mind the second half—they have knowledge of parabolas! They are applying that knowledge! And they are on the right track!

Even better was the conversation when I came by:

“Hey, great start. Where’d the -2.5 come from?”

“It’s part of the vertex. But we have to find a, and we don’t know the other value.”

“But where’d you get 2.5 from?”

“It’s halfway from 5.”

Suddenly Janice got it.

“Omigod–this IS the vertex! 144 is y! 2.5 is x! We can use the vertex form and (h,k)!!”

The football player: “Does it matter if it doesn’t start from the ground?”

Me: “Good question. You might want to think about any other point I gave you.”

I went away and let them chew on that; a few minutes later the football player came running up to me: “It’s 2!” and damned if they hadn’t solved for a the next time I came by.

Here’s one of the two top groups, at about the same time. (Blurry because they were in the deep background of another picture). They’d figured out the vertex and were discussing the best way to find b.

neg16closeupclasswork

Mark was staring at the board. “How come, if we’re ignoring all the small stuff, the rocket won’t come straight back down? Why are you sure it’s not coming back to the roof?”

“Oh, it could, I suppose. Let me see if I can find you a better answer.” He moved away, when I was struck by a thought. “Hey….doesn’t the earth move? I mean yes, the earth moves. Wouldn’t that put the rocket down in a different place?”

“Is that it?”
“Aren’t you taking physics? Go ask your teacher. Great questions.”

I suggested taking a look at the factored form to find b but they did me one better by using “negative b over 2a” again and solving for b (which I hadn’t thought of), leading to Mark’s insight “Wait–the velocity is always 32 times the seconds to max height!”

The other kids had all figured out the significance of the vertex form, and were all debating whether it was 2.5 or 2 seconds, generally calling me over to referee.

One group of four boys, two Hispanics, one black, one Asian (Indian), all excellent students, took forever to get started, arguing ferociously over the vertex question for 10 minutes before I checked on them to see why they were calling each other “racist” (they were kidding, mostly). I had to chastise the winners for unseemly gloating. Hysterical, really, to see alpha males in action over a math problem. Their nearly-blank board, which I photographed as a rebuke:

neg16classwork4

The weaker group made even more progress (see the corrections) and the group to their left, middling ability, in red, was using standard equation with a and c to find b:
neg16fin3

My other top group used the same method, and had the best writeup:
neg16fin2

Best artwork had the model wrong, but the math mostly right:
neg16mid

  • All but one group had figured out they wanted to use vertex form for the starting point.
  • All but one group had kids in it that realized the significance of the 80 foot mark (the mirror point of the initial height)
  • All the groups figured out the significance of five seconds.
  • All the groups were able to solve for both a and b of the standard form equation.
  • The top three groups worked backwards to find the “fake” zero.
  • Two groups used the vertex algorithm to find b.
  • All the groups figured out that b had to be the velocity.

So then, after they figured it all out, I gave them the algorithm:

h(t)=-16t2 + v0t + s0.

Then I gave them Felix Baumgartner, the ultimate in a negative 16 problem.

And….AND!!!! The next day they remembered it all, jumping into this problem without complaint:projmotfollowup

Charles Murray retweeted my why not that essay, saying that I was the opposite of an educational romantic, and I don’t disagree. But he’s also tweeted that I’m a masochist for sticking it out—implying, I think, that working with kids who can’t genuinely understand the material must be a sad and hopeless task. (and if he’s not making that point, others have.) I noticed a similar line of thought in this nature/nurture essay by Tom Bennett says teachers would not write off a child with low grades as destined to stack shelves –implication that stacking shelves is a destiny unworthy of education.

The flip side of that reasoning looks like this: Why should only some students have access to a rich, demanding curriculum and this twitter conversation predicated on the assumption that low income kids get boring curricula with no rigor and low expectations.

Both mindsets have the same premise: education’s purpose is to improve kids’ academic ability, that education without improvement is soulless drudgery, whether cause or effect. One group says if you know kids can’t improve, what a dreary life teaching is. The other group says dreary teaching with low expectations is what causes the low scores—engage kids, better achievement. Both mindsets rely on the assumption that education is improvement.

Is it?

Suppose that in six months my weakest kids’ test scores are identical to the kids who doodled or slept through a boring lecture on the same material. Assume this lesson does nothing to increase their intrinsic motivation to learn math. Assume that some of the kids end up working the night shift at 7-11. Understand that I do make these assumptions.

Are the kids in my class better off for the experience? Was there value in the lesson itself, in the culmination of all those worksheets that gave them the basis to take on the challenge, in the success of their math in that moment? Is it worth educating kids if they don’t increase their abilities?

I believe the answer is yes.

Mine is not in any way a dreary task but an intellectual challenge: convince unmotivated students to take on advanced math—ideally, to internalize the knowledge for later recall. If not, I want them to have a memory of success, of achievement—not a false belief, not one that says “I’m great at math” but one that says “It’s worth a try”. Not miracles. Just better.

I would prefer an educational policy that set more realistic goals, gave kids more hope of actual mastery. But this will do in the meantime.

I have no evidence that my approach is superior, that lowering expectations but increasing engagement and effort is a better approach. I rely on faith. And so, I’m not entirely sure that I’m not an educational romantic.

Besides. It’s fun.


The Release and “Dumbing it Down”

I’ve said before I’m an isolationist whose methods are more reform than traditional. I try to teach real math, not some distorted form of discovery math, but I also try to avoid straight lecture. I want to make real math accessible to the students by creating meaningful tasks, whether practice or illustration, that they feel ready to tackle.

I can’t tell you that students remember more math if they are actively working the problems I give them. Research is not hopeful on this point (Larry Cuban does a masterful job breaking down the assumptions that chain from engagement to higher achievement.) Will my students, who are often actively engaged in modeling and working problems on their own, retain more of the material than the students who stare vacantly through a lecture and then doodle through the problems? Or six months from now, are they all back to the same level of math knowledge? I fear, I suspect, it’s the latter. I think we could do better on this point if we gave students less. Not Common Core “less”, in which they just shovel the work at the students earlier. But a lot less math, depending on their ability and interest, over the four year period of high school.

Four plus years of teaching has given me a lot more respect for the sheer value of engagement, though. I believe, even if I can’t prove, that the kid who works through class, feeling successful and capable of tackling problems that have been (god save me for using this word) scaffolded for his ability, has learned more than the kid who sits and does nothing. Even if it’s not math.

Anyway. There comes a moment when the teacher says to the students, “go”. Best described as release of responsibility, whether or not a teacher follows any particular method, it’s when the teacher finishes the lecture, the class discussion, or simply handing out the task the students are supposed to take on without any other instruction.

It’s the moment when novices often feel like Mork. Done poorly, it’s the lost second half of a lesson. Done well, it’s the kind of moment that any observer of any philosophy would unhesitatingly describe as “good teaching”.

I started off being pretty good at release, and got better. That is, as a novice using straightforward explanation/discussion (I rarely lecture per se) or an illustrating activity, I could usually get 30% of the class going right away, another 40% doing a problem or two before asking for reassurance, and convince most of the remaining 30% to try it with explicitly hand-crafted persuasion. And for a new teacher, that’s nothing to sneeze at. Sure, every so often I let them go to utter silence, or a forest of raised hands, but only rarely. (And every teacher gets that sometimes.)

I remember pointing out to my teacher instructor, however, that I spent a lot of time re-explaining to kids. He said “Yeah, that’s how it works. You’re going to get some of them during the first explanation, some of them while helping them through the first task….” and basically validated the stats I just described in the previous paragraph. I still think he’s right about the fundamental fact: teachers can’t get everyone right away.

But all that re-explaining is a lot of work, and it leads to kids sitting around waiting for their personal explanation—and no small number of kids who then decide why bother listening to the lecture anyway, since they won’t get it until I explain it to them again, with of course the stragglers, the last 30%, screwing around until I show up to convince them to try. Of course, I went through (and still go through) the exhortation process, telling them to ask questions, “checking for understanding”, and so on.

And it absolutely does help to make the “release” visible to the kids, “Okay, let’s be clear–we are wrapping up the explanation portion, it’s time for work, and I WILL NOT BE HAPPY if you shoot your hand up right after I say ‘go’ and whine about how you don’t get it.”

This works. No, really. Kids say “Could you go through it one more time?” before I release them, particularly after I’ve put them “on blast mode” for saying “I don’t get it” when I show up at their desk to see where they are.

But I focused on release almost immediately as an area for my own improvement. As I did so, I began to understand why release is so hard for teachers, particularly new ones.

We overestimate. We think, “I explain it, they do it.” We think, “I gave them instructions they can follow.” We think, “This is the easy part” and are already mapping out how we’ll explain the hard part.

And then we say “Fly, be free!” and the class drops with a splat. Burial at sea. Wash away the evidence.

We aren’t explaining enough. Or they aren’t listening. We aren’t giving clear instructions. They don’t read the instructions. “Too many words.”

What I have discovered, over time, is that I must halve or even quarter what I think students can do, and then deliver it at half the pace. With this adjustment, I can release them to work that they will find challenging, but doable. This is the big news, the news that I pass on to all new teachers, the news they invariably scoff at first and then, reluctantly, acknowledge to be true.

But what I have begun to realize, again over time, is that by first “dumbing it down”, I have slowly increased the difficulty and breadth of coverage I can deliver. Not a lot. But some. For example, I now teach the modeling of inequalities, modeling of absolute values, and function operations, in addition to modeling linear equations, exponentials, probability, and binomial multiplication. I don’t think my test scores have increased as a result, but it makes me feel better about what my course is called, anyway.

In mulling this development, I have concluded, tentatively, that I’ve become a better teacher. Or at least a better curriculum developer. That is, I don’t think “dumbing down” itself has led to my increased coverage or my students’ ability to handle the topic. But I’ve gotten better at the “release”, at developing explanations and tasks that allow the students to engage in the material.

It’s possible I’ve been unwittingly participating in a positive feedback loop. As I get better at the release, at correctly matching their ability to my tasks and explanations, the students are more likely to listen, to try to learn, to dig in to a new task and give it a shot. So I get bolder and come up with ideas for more complex subjects.

I dunno. Here’s what I do know: effective release requires willing students. The able students are willing by default. The rest of them need something else.

Put it another way: the able students have trust in their own abilities. The kids who don’t trust in their own abilities need to trust me.

No news there, that trust is an essential part of teaching. But I’m only now considering that my lesson sequencing and content might be an essential element in building the trust the students need to take on challenges.

Eighteen months ago, I wrote an essay that captured the moment when teachers realize that their students don’t retain learning. They demonstrate understanding, they pass tests demonstrating some ability, and then two weeks, three weeks, a couple months later, it’s gone. (Every SINGLE time I introduce completing the square, it’s a day.)

The “myth” essay describes what happens after release. That is, after the teacher realizes that students didn’t understand the lecture, didn’t understand the worksheet, are goofing off until the teacher comes around to give one on one tutoring, after the teacher does the additional work to get the instruction out, the kids seem to get it. And then forget it all completely, or remember it imperfectly, or rush at problems like stampeding cattle and write down anything just to have an answer.

So consider this the companion piece: the front end of classroom teaching to the myth’s back end.

But in fact, it’s all part of the same problem. And, as I said in the first essay, teachers tend to react in one of two ways: Blame or Accept. Many accepters just skedaddle to higher ability students. I’m teaching precalc this year and have some interesting observations on that point. But leave that for another essay.

I’m an accepter:

Acceptance: Here, I do not refer to teachers who show movies all day, but teachers who realize that Whack-a-Mole is what it’s going to be. They adjust. Many, but not all, accept that cognitive ability is the root cause of this learning and forgetting (some blame poverty, still others can’t figure it out and don’t try). They try to find a path from the kids’ current knowledge to the demands of the course at hand, and the best ones try to find a way to craft the teaching so that the kids remember a few core ideas.

On the other hand, these teachers are clearly “lowering expectations” for their students.

And that’s me. I lower expectations. I do my best to come up with intellectually challenging math that my students will tackle. I don’t lecture because the kids will zone out; instead, I have a classroom discussion in which the kids live in some terror that I might call on them to answer a question, because they know I won’t ask for raised hands. So they should maybe pay attention. I have no problem with students taking notes, but for the most part I know they don’t, and I don’t require it. I give them a graphic organizer with key formulas or ideas (or they add them). I periodically restate the critical documents they should save, tell them I designed the documents to be useful to them in subsequent math classes, double check them periodically to see if they have the key material.

Dan Meyer sees himself as a math salesman. I see myself as selling….competence? Ability? A sense of achievement?

Whatever. When you read of those studies showing that math courses don’t match the titles, you’re reading about courses I teach. I teach the standards, sure, but I teach them slowly, and under no circumstances are the kids in my algebra II class getting anything close to all of second year algebra, or the geometry students getting anywhere near all the geometry coverage. That’s because they don’t know much first year algebra, and if you’re about to say that the Next New Thing will fix that problem, then you haven’t been paying attention to me for the past two years.

But at some point, maybe we’ll all realize that the issue isn’t how much we teach, but how much they remember.

Or not.

Be clear on this point: I do not consider myself a hero, the one with all the answers. I am well aware that many math teachers see teachers like me as the problem. Many, if not most, math teachers believe that kids can learn if they are taught correctly, that the failings they see are caused by previous teachers. And I constantly wonder if they are right, and I’m letting my students down. While I sound confident, I want to be wrong. Until I can convince myself of that, though, onwards.

I began this essay intending to describe a glorious lesson I taught on Monday, one in which I released the kids and by god, they flew. But I figured I’d explain why it matters first.